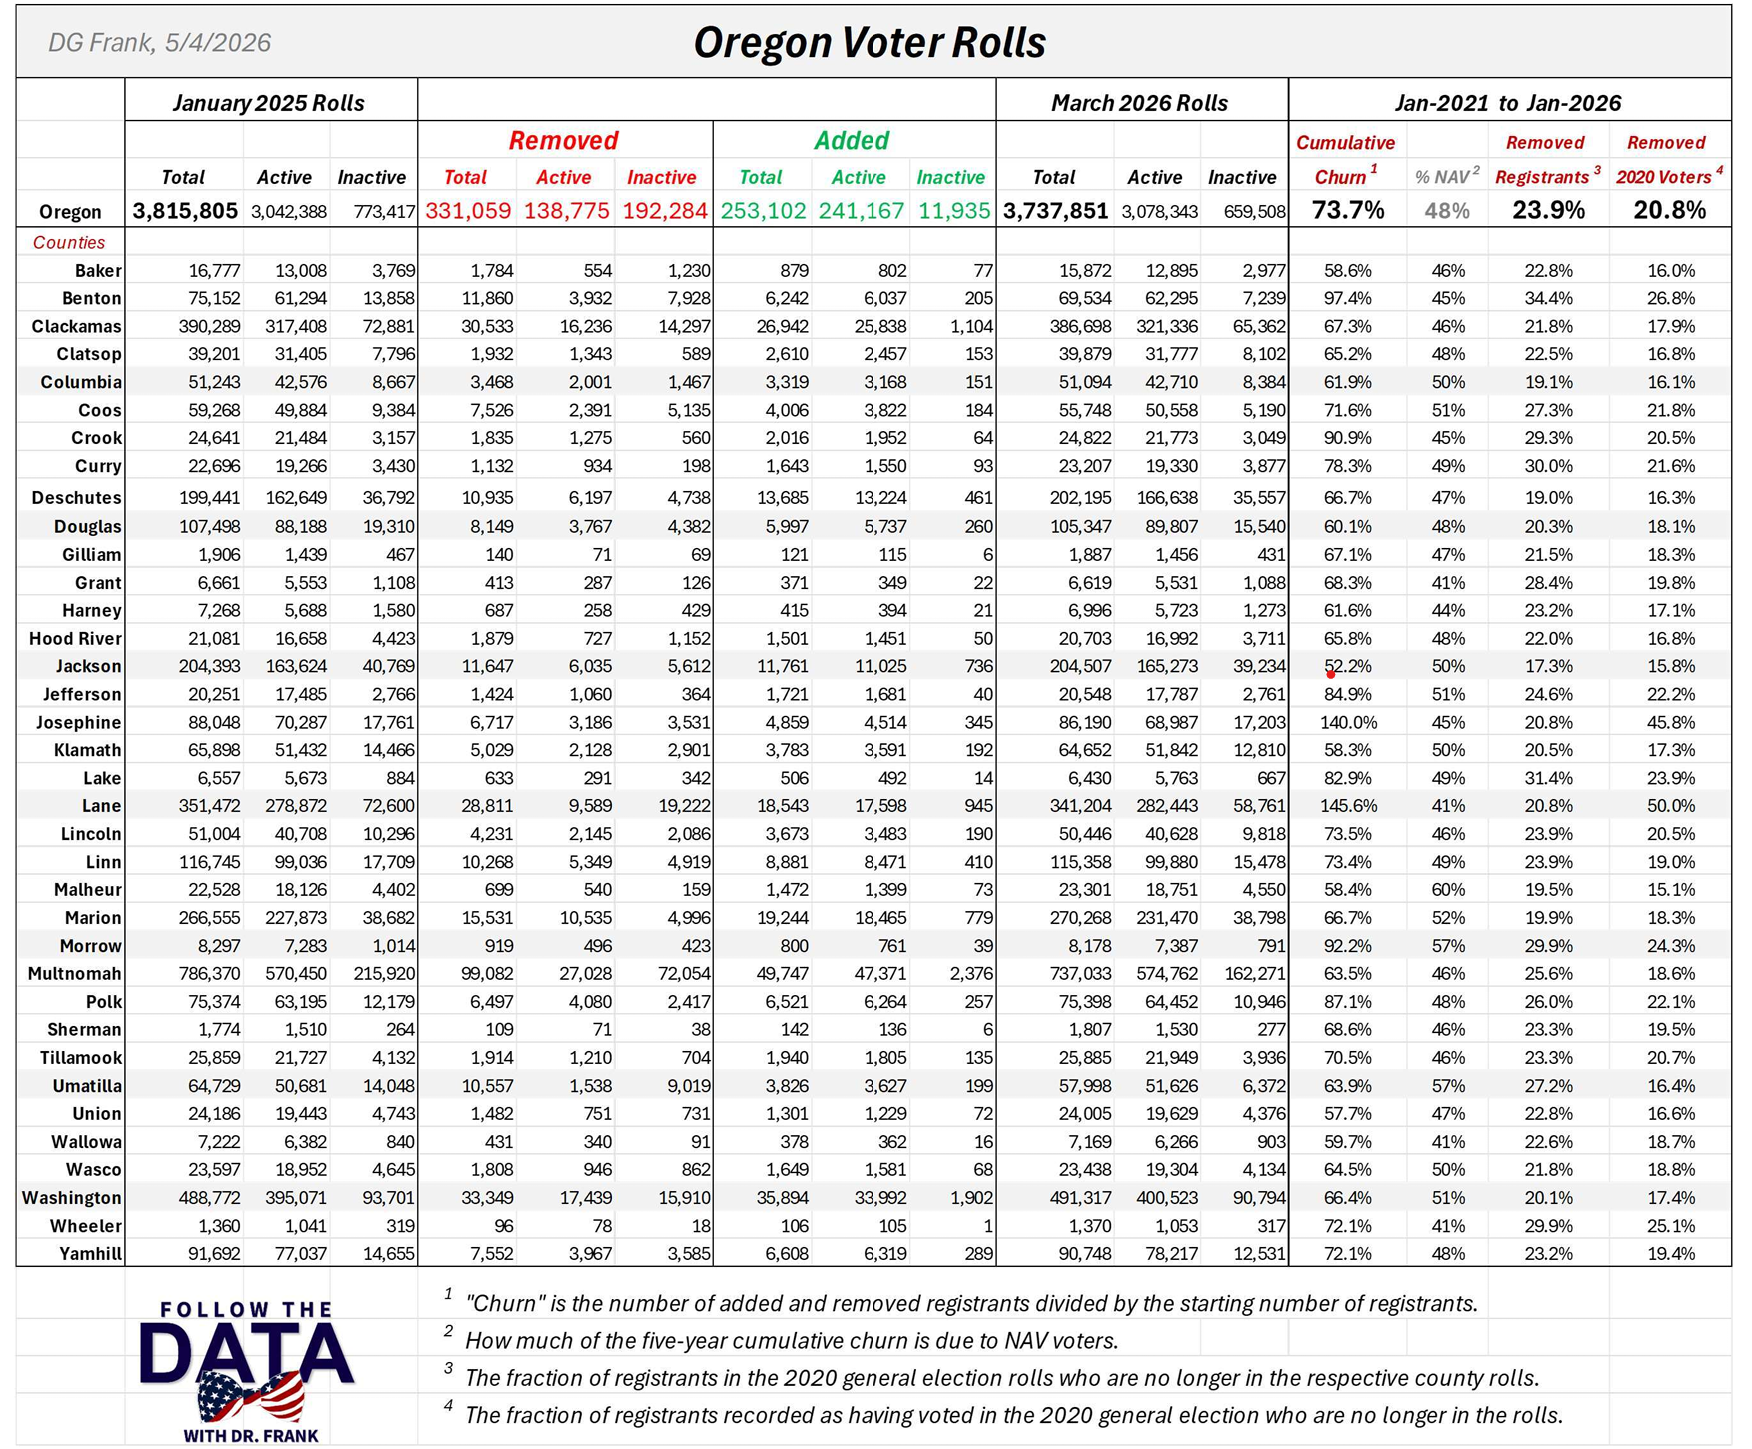

Dr. Frank's chart below shows the percent of "churn" in every Oregon County. "Churn" is the "turnover" in voting population. He shows that from January 2021 - January 2026, 73.7% of Oregonians moved and were replaced. Does that make sense to you?
Total = Total # of registered voters per county and overall Registered voters fall into two categories: Active = Voters who are sent ballots Inactive = Voters who are not supposed to be sent ballots
Removed and Added: The number of voters removed and added in just over one year - from January 2025 to March 2026
Jan-2021 to Jan-2026: The cumulative number of voters removed and added over the five-year period: the "churn" by county and statewide